Cart(0)


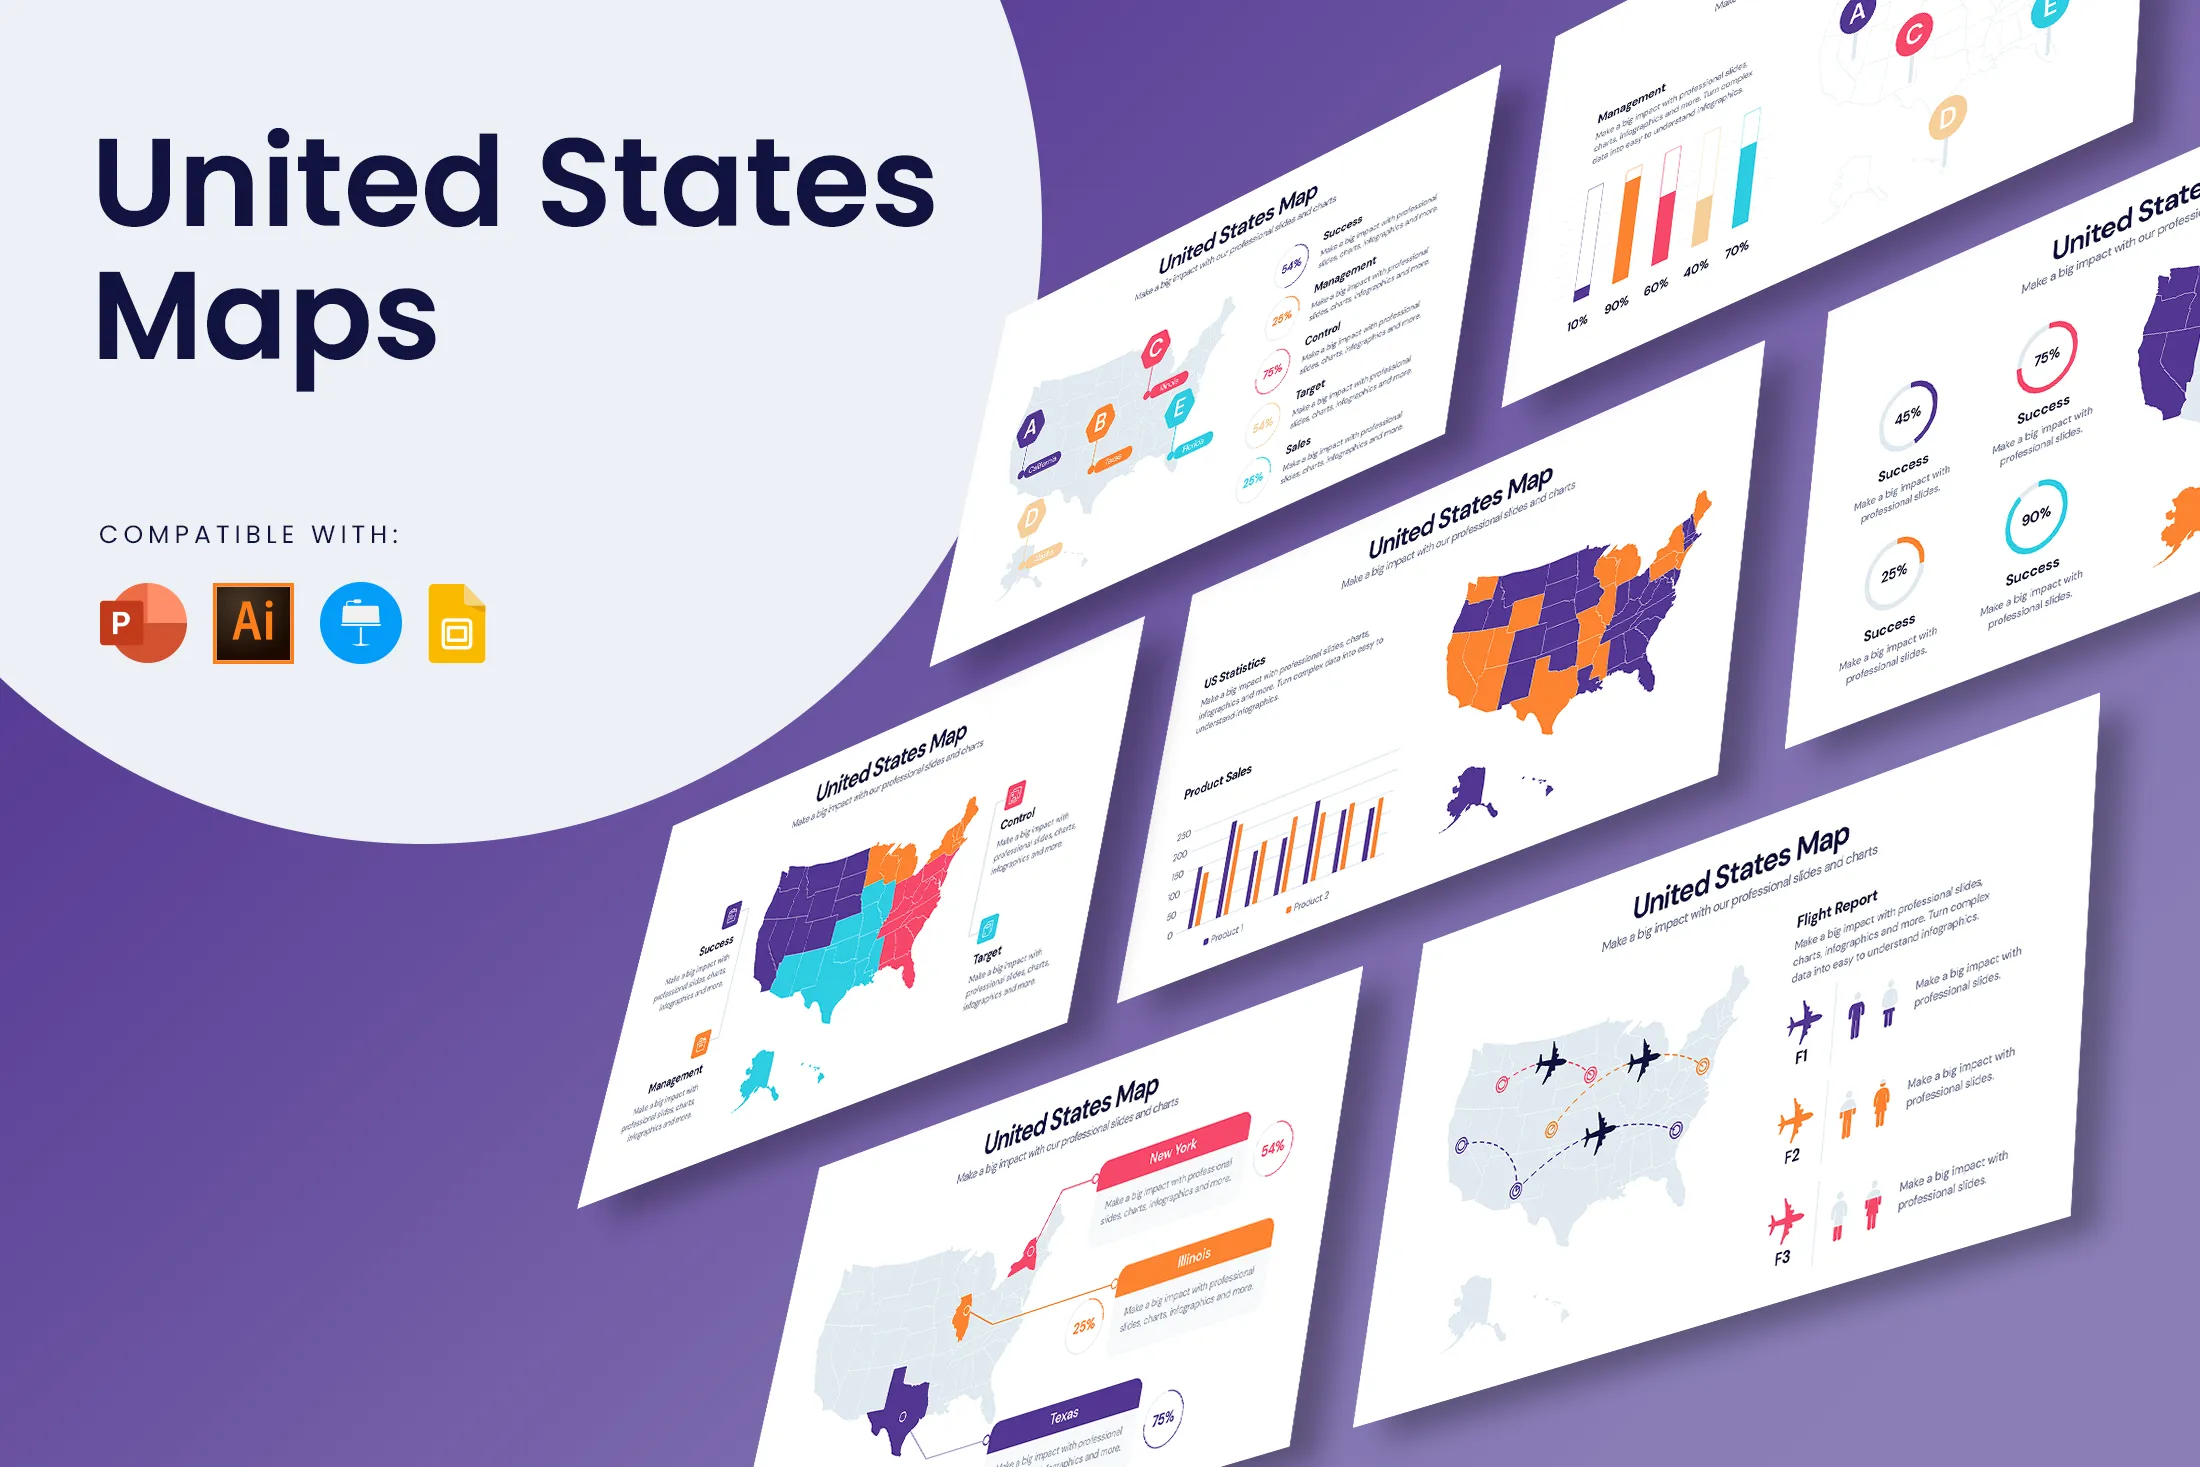

There are many reasons for which a map of the United States may come in handy. You could use it to show election progress, map out a road trip across the states, or to highlight agricultural areas and their dominant production. Whatever the need may be these infographics can help you display your data.
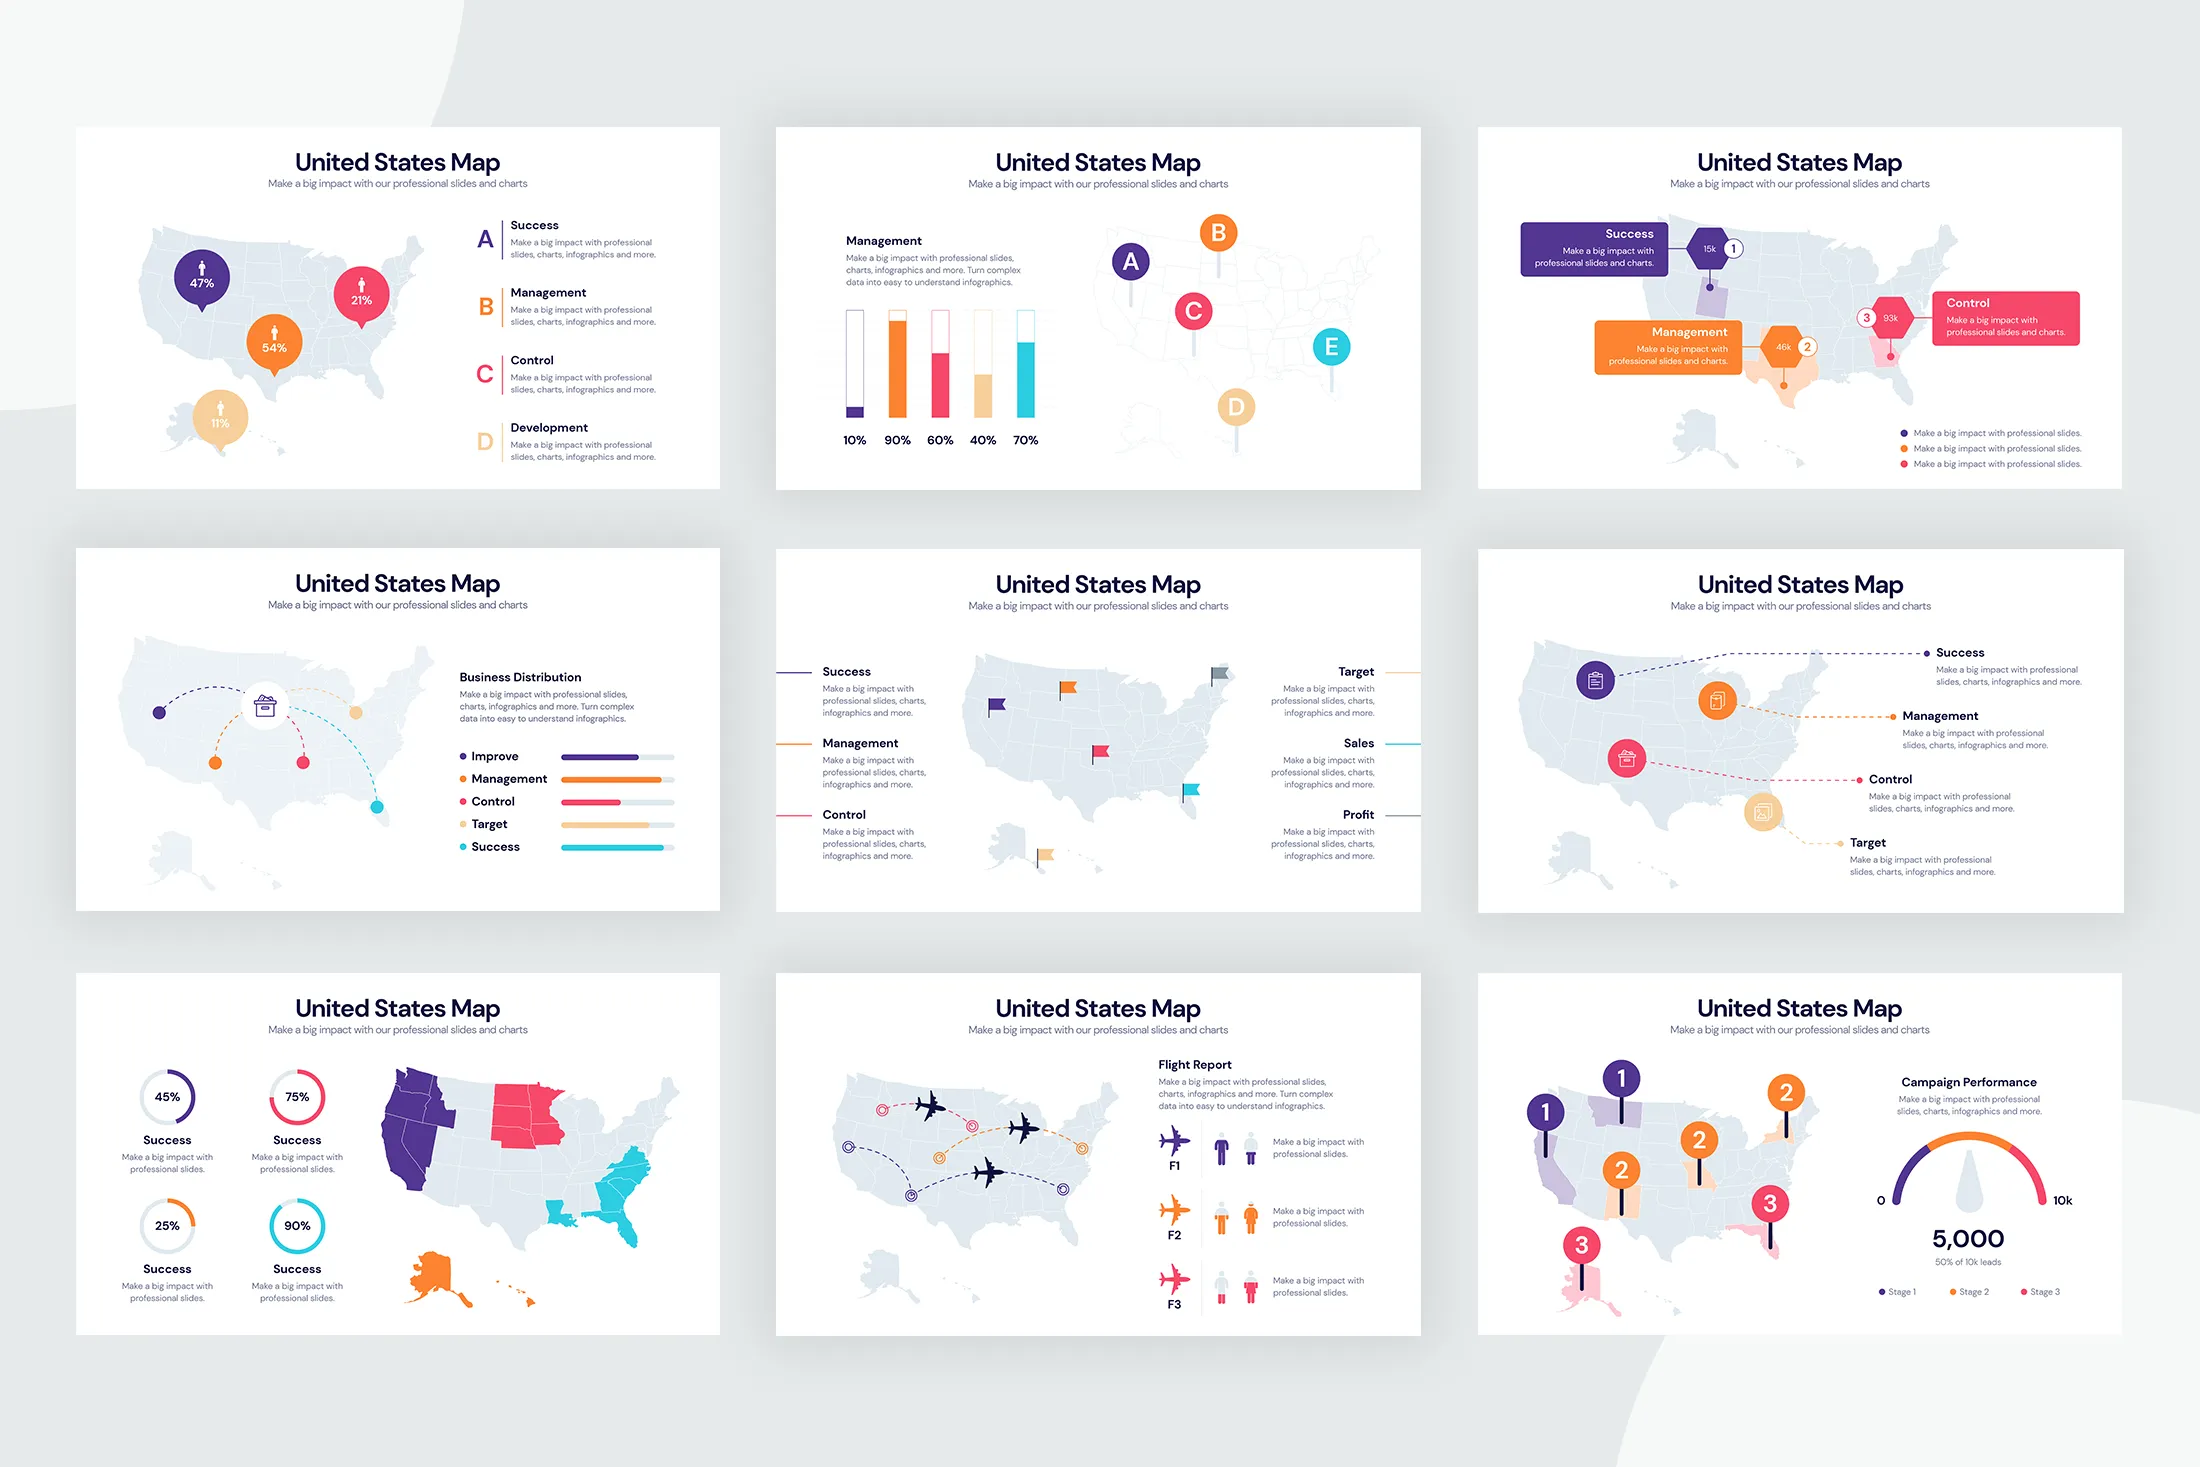
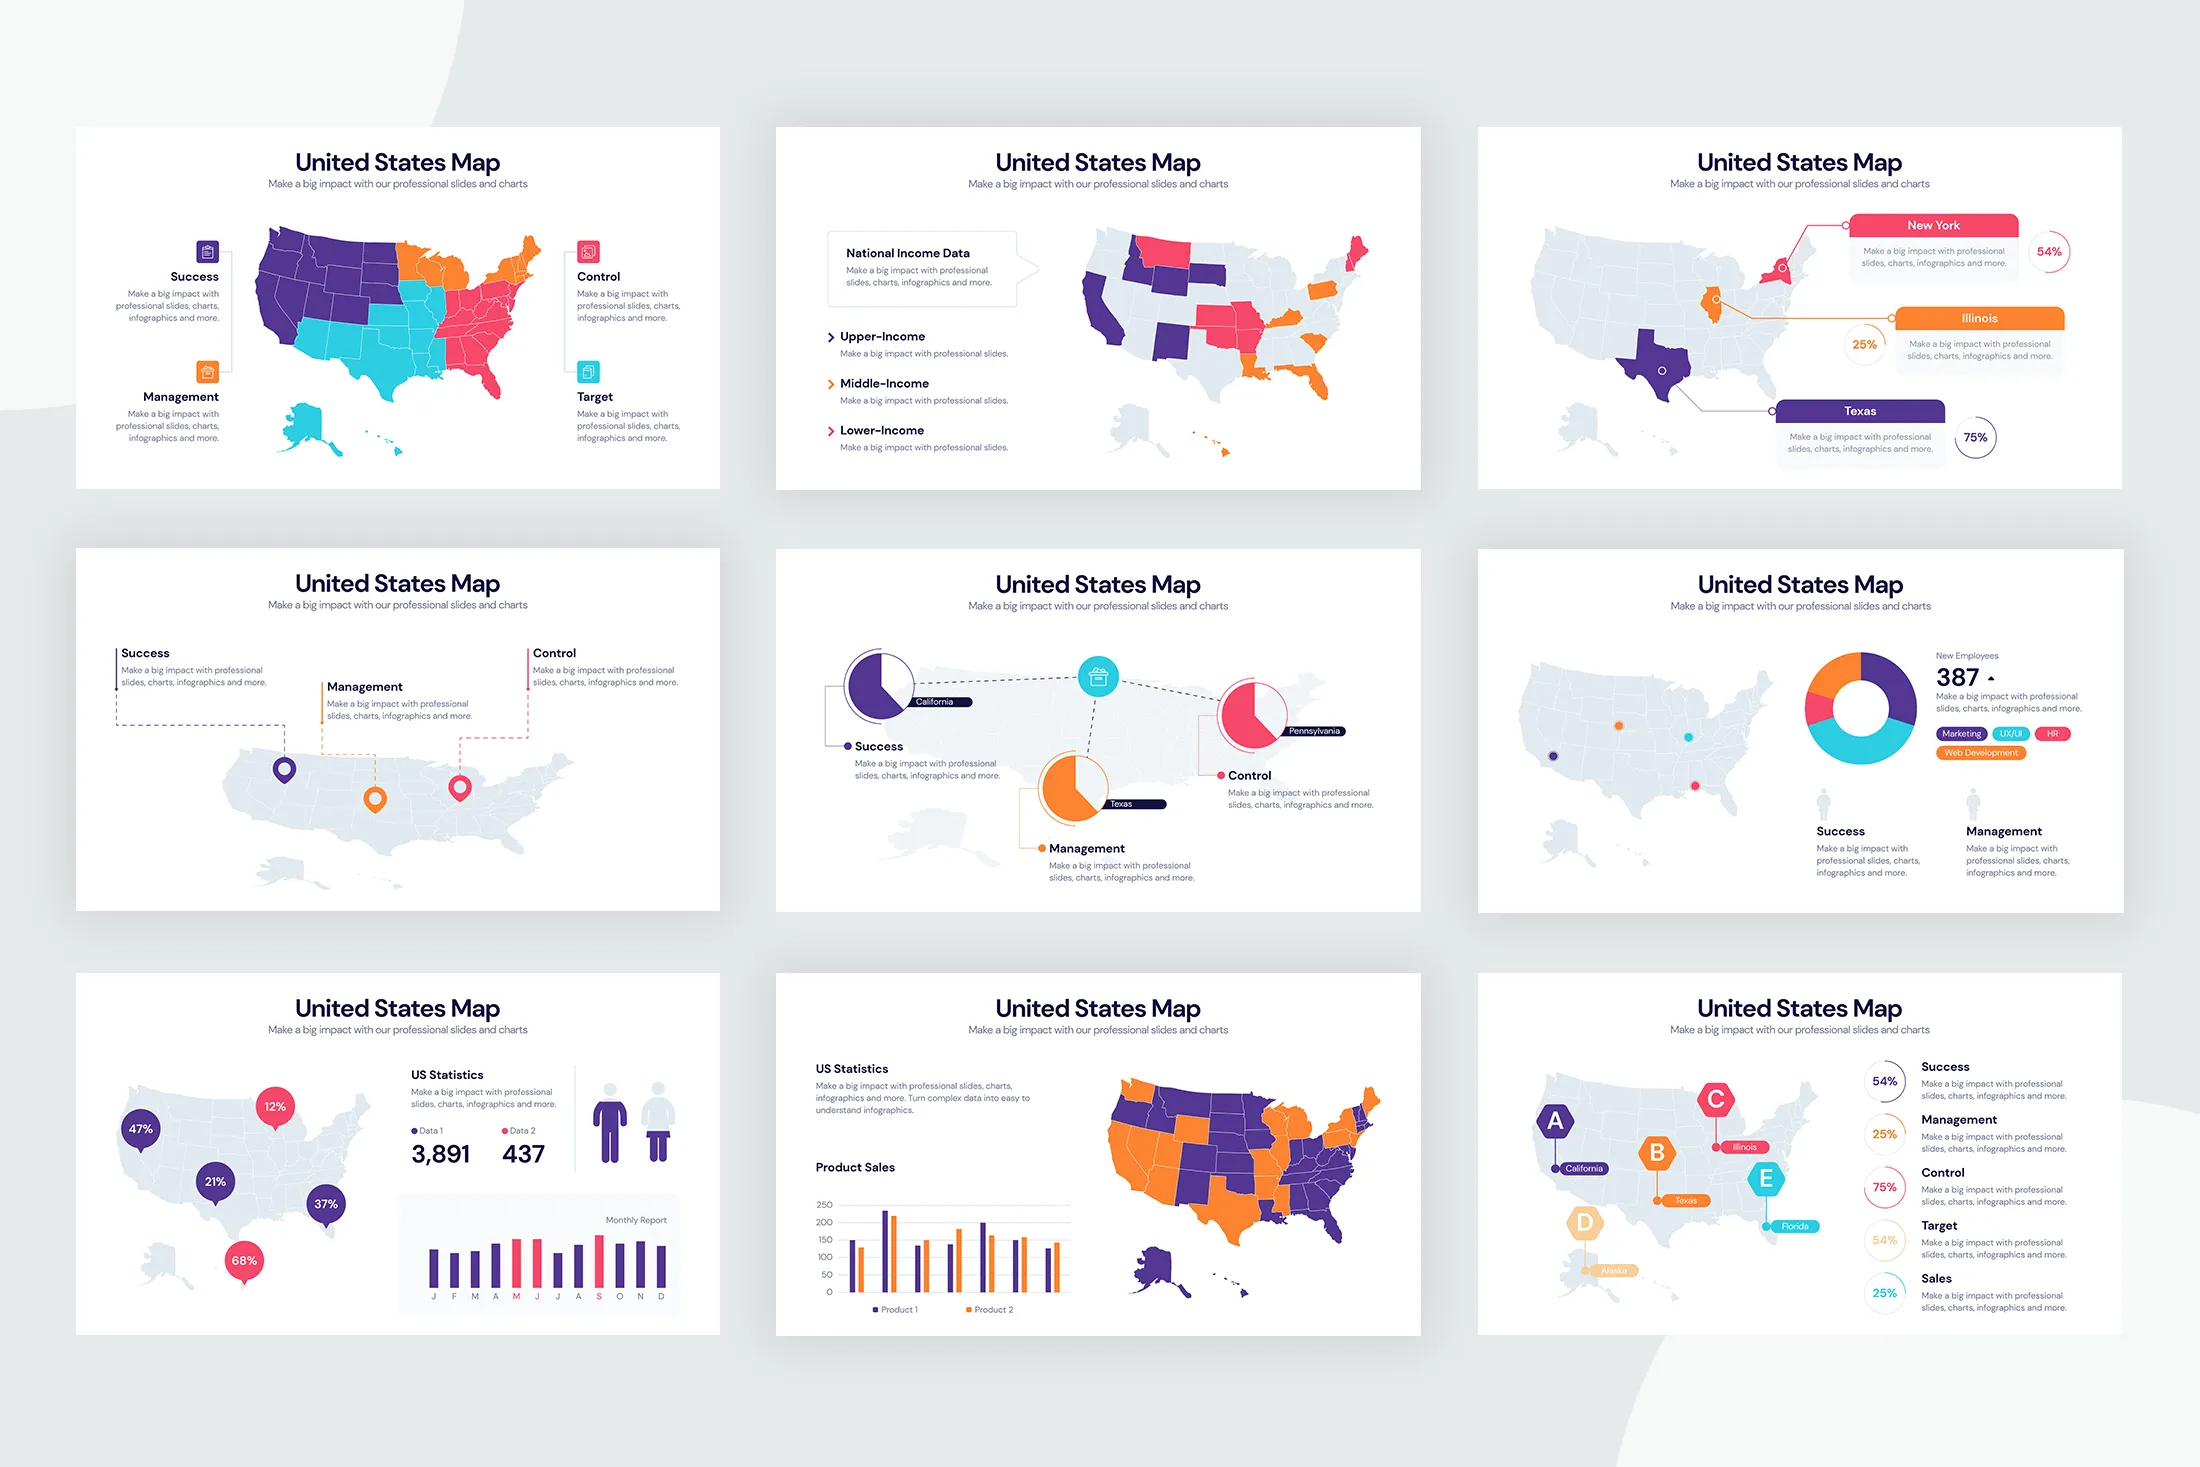
These maps can pinpoint specific locations with ease and designates enough space to dive into the details of that location. These templates include bar graphs, pie charts, and a performance indicator so you can accurately display numerical data in a manner that is organized and interactive.
All elements are fully customizable. If you have any questions send us a message.


